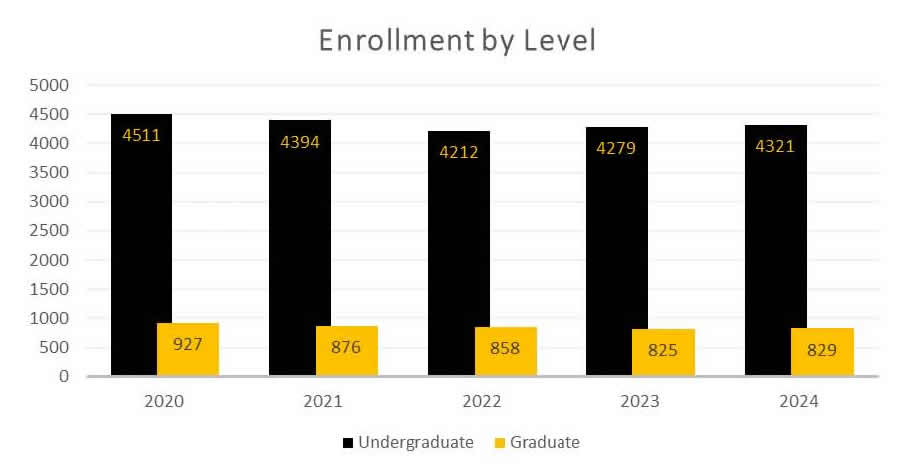
Enrollment By Level

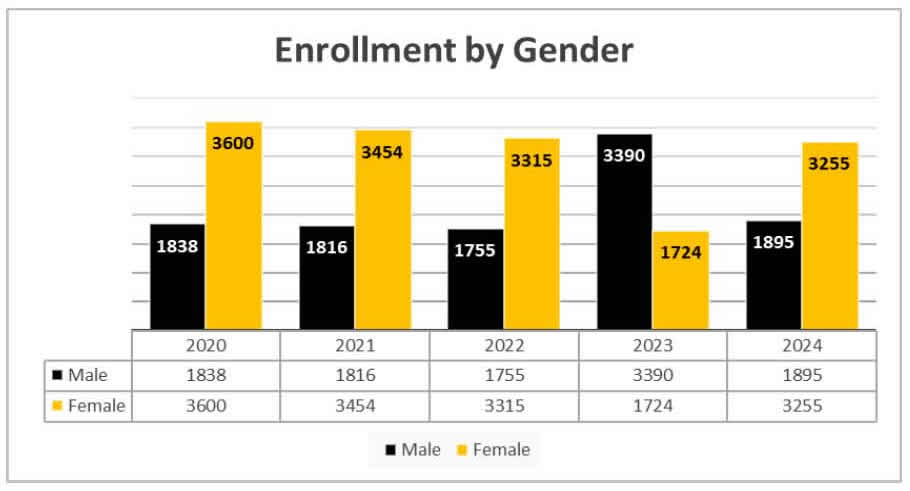
Enrollment By Gender

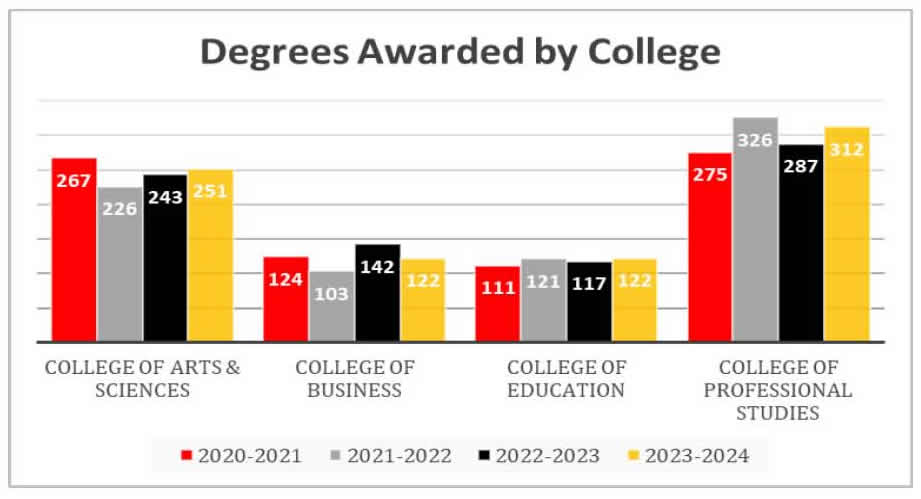
Degrees Awarded By College

| Headcount Enrollment by Ethnicity | ||||||||||
|---|---|---|---|---|---|---|---|---|---|---|
| Semester | Non-Resident Alien | Black, Non-Hispanic | American Indian/Alaskan Native | Asian or Pacific Islander | Hispanic | White, Non-Hispanic | Two or more races | Native Hawaiian or other Pacific Islander | Unknown | Total |
| Fall 2020 | 159 | 4,921 | 8 | 7 | 70 | 41 | 107 | 0 | 125 | 5,438 |
| Fall 2021 | 142 | 4,795 | 6 | 6 | 64 | 39 | 103 | 0 | 115 | 5,270 |
| Fall 2022 | 109 | 4,645 | 9 | 4 | 67 | 28 | 103 | 1 | 104 | 5,070 |
| Fall 2023 | 105 | 4,750 | 9 | 8 | 75 | 38 | 116 | 1 | 12 | 5,114 |
| Fall 2024 | 369 | 4,546 | 2 | 6 | 87 | 39 | 100 | 1 | 0 | 5150 |